Using Momentum Indicators to Predict and Trade Market Trends: A Comprehensive Guide
An Introduction to Momentum Indicators
The sphere of finance is an ever-changing, dynamic landscape. Traders and investors constantly need tools and strategies that can inform their decisions and offer them an advantage. One set of tools gaining significant traction among market participants is momentum indicators. These analytical aids function like a trader’s compass, guiding them towards profitable trading decisions. But what do we mean by momentum indicators? And how do they function within the broader context of a trader’s toolkit?
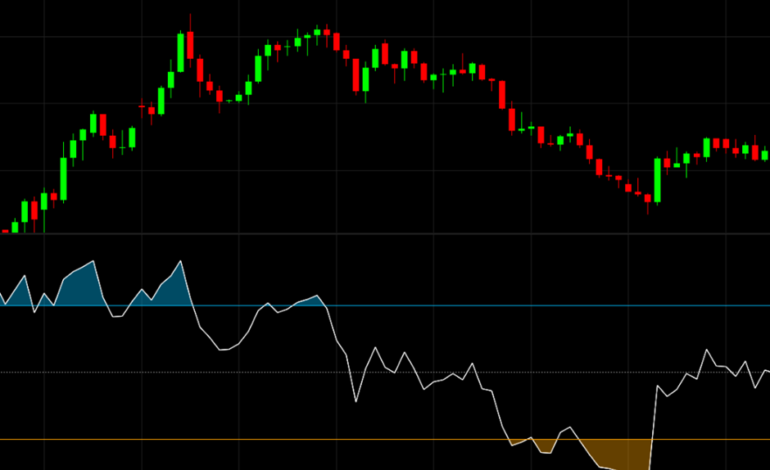
In the realm of technical analysis, momentum indicators refer to tools that gauge the speed or rate of price change for a financial instrument over a specified time period. By providing insights into the relative strength or weakness of a market trend, they empower traders to exploit price fluctuations and identify potential trading opportunities.
Understanding the Principle of Momentum
The concept of momentum in trading is analogous to Newton’s First Law of Motion, which states that an object in motion tends to remain in motion unless acted upon by an external force. Similarly, in financial markets, a trend (whether upward or downward) is likely to persist until a potent counter force emerges. In essence, the principle of momentum underscores the inertia of market trends, aiding traders in predicting future price movements based on current trends.
An Exploration of Key Momentum Indicators
The best momentum indicators are those that offer reliable, actionable insights into market trends. The most widely recognized among these include the Relative Strength Index (RSI), Moving Average Convergence Divergence (MACD), and Stochastic Oscillator. These indicators serve dual functions—they not only help predict price trends but can also signal potential market reversals.
The RSI, operating within a range of 0 to 100, measures the speed and change of price movements, with readings above 70 typically suggesting overbought conditions and below 30 indicating oversold conditions. The MACD tracks the relationship between two moving averages of a security’s price, offering bullish or bearish signals depending on whether the MACD line crosses above or below the signal line. The Stochastic Oscillator compares a security’s closing price to its price range over a specific period, indicating potential overbought or oversold conditions.
Diving Deeper: Practical Applications of Momentum Indicators
Although these momentum indicators might sound complex, their practical application can be surprisingly straightforward. Traders often use them in tandem with one another to confirm trends and ensure they’re not relying too heavily on a single indicator. For instance, a trader might look for an overbought signal from the RSI and then seek confirmation from the MACD or Stochastic Oscillator before deciding to sell. Such multi-faceted usage helps traders avoid false signals and make more informed decisions.
Bridging the Digital Divide: The Role of Connectivity
You might be wondering how the phrase “Solve Your Connectivity Woes: Essential Tips and Tricks” fits into our discussion about trading and momentum indicators. While it may seem out of context initially, it draws a parallel between the role of momentum indicators in trading and the role of connectivity in our digital lives. As traders use momentum indicators to improve their trading strategies, similarly, we troubleshoot and enhance our internet connectivity for a better online experience. Both scenarios involve leveraging tools and strategies to improve outcomes and user experience in their respective fields.
Momentum Indicators and Risk Management
One crucial aspect that traders need to consider while using momentum indicators is risk management. Indicators, despite their utility, are not foolproof. They can sometimes give false signals or lag behind real-time price changes. Therefore, it’s critical to use them in conjunction with stop-loss orders and other risk management strategies to protect against potential losses.
Concluding Thoughts and Further Exploration
In summary, momentum indicators play an instrumental role in helping traders predict and navigate market trends. They offer a quantifiable approach to understanding market momentum and provide valuable signals for buy and sell decisions. However, their effective utilization requires an understanding of their underlying principles and a commitment to continuous learning and adaptation.
Just as we seek to solve our connectivity issues for smoother online navigation, refining the use of momentum indicators is crucial for seamless trading experiences. And while this article offers an introduction to momentum indicators, further exploration could involve a more detailed examination of each indicator, real-world trading examples, and an investigation into more advanced momentum-based strategies.


